The Netflix Tech Blog: Extracting image metadata at scale
Save article ToRead Archive Delete · Log in Log out
4 min read · View original · techblog.netflix.com
We have a collection of nearly two million images that play very prominent roles in helping members pick what to watch. This blog describes how we use computer vision algorithms to address the challenges of focal point, text placement and image clustering at a large scale.
Focal point
All images have a region that is the most interesting (e.g. a character’s face, sharpest region, etc.) part of the image. In order to effectively render an image on a variety of canvases like a phone screen or TV, it is often required to display only the interesting region of the image and dynamically crop the rest of an image depending on the available real-estate and desired user experience. The goal of the focal point algorithm is to use a series of signals to identify the most interesting region of an image, then use that information to dynamically display it.

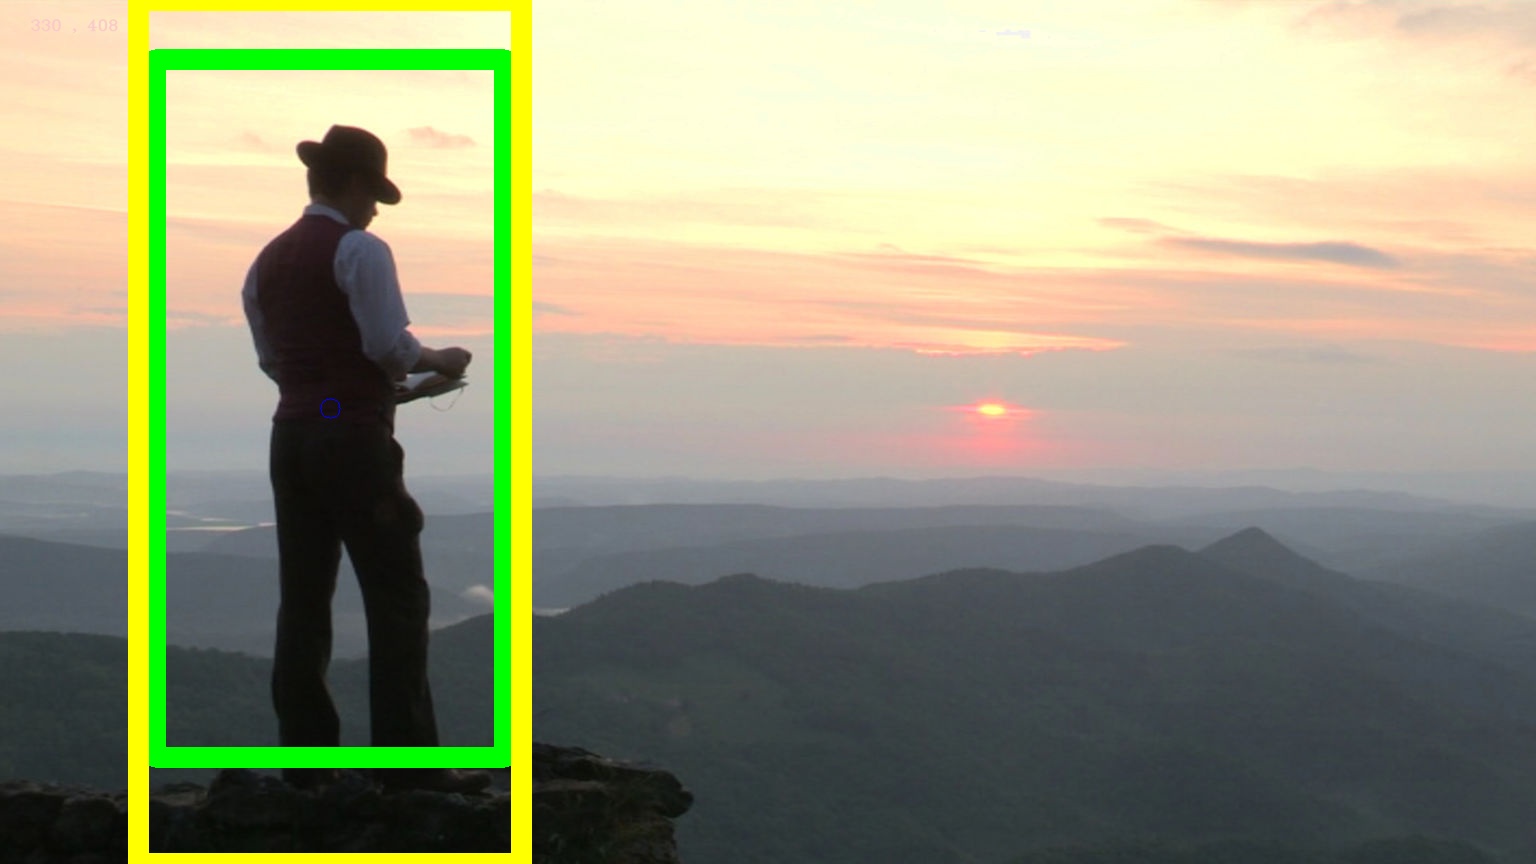
[Examples of face and full-body features to determine the focal point of the image]
We first try to identify all the people and their body positioning using Haar-cascade like features. We also built haar based features to also identify if it is close-up, upper-body or a full-body shot of the person(s). With this information, we were able to build an algorithm that auto-selects what is considered the "best' or "most interesting" person and then focuses in on that specific location.
However, not all images have humans in them. So, to identify interesting regions in those cases, we created a different signal - edges. We heuristically identify the focus of an image based on first applying gaussian blur and then calculating edges for a given image.
Here is one example of applying such a transformation:
 /
/
///Remove noise by blurring with a Gaussian filter
GaussianBlur( src, src, Size(n,n ), 0, 0, BORDER_DEFAULT );
/// Convert the image to grayscale
cvtColor( src, src_gray, CV_BGR2GRAY );
/// Apply Laplace function
Laplacian( src_gray, dst, ddepth, kernel_size, scale, delta, BORDER_CONSTANT );
convertScaleAbs( dst, abs_dst );
Below are a few examples of dynamically cropped images based on focal point for different canvases:
Text Placement
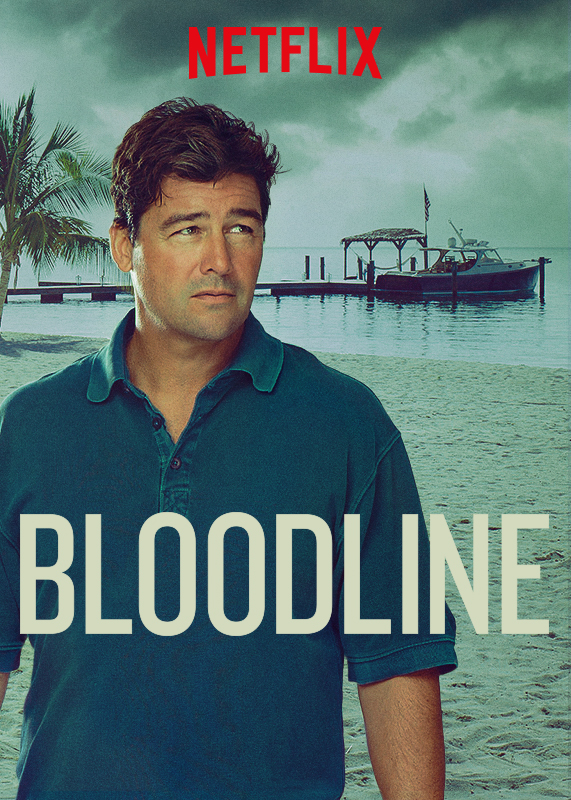
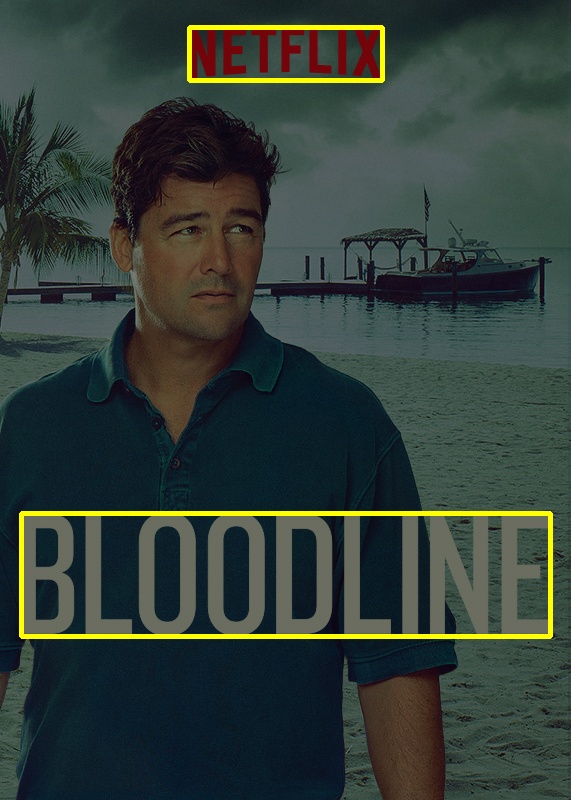
Another interesting challenge is determining what would be the best place to put text on an image. Examples of this are the ‘New Episode’ Badge and placement of subtitles in a video frame.

[Example of “New Episode” badge hiding the title of the show]
In both cases, we’d like to avoid placing new text on top of existing text on these images.
Using a text detection algorithm allows us to automatically detect and correct such cases. However, text detection algorithms have many false positives. We apply several transformations like watershed and thresholding before applying text detection. With such transformations, we can get fairly accurate probability of text in a region of interest for image in large corpus of images.
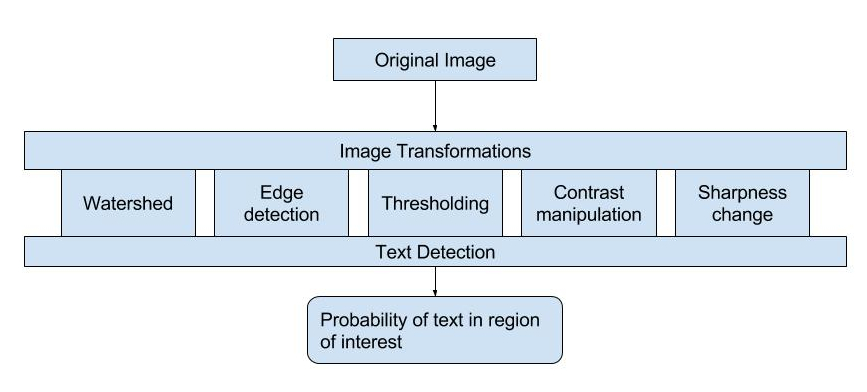

[Results of text detection on some of the transformations of the same image]
Image Clustering
Images play an important role in a member’s decision to watch a particular video. We constantly test various flavors of artwork for different titles to decide which one performs the best. In order to learn which image is more effective globally, we would like to see how an image performs in a given region. To get an overall global view of how well a particular set of visually similar images performed globally, it is required to group them together based on their visual similarity.
We have several derivatives of the same image to display for different users. Although visually similar, not all of these images come from the same source. These images have varying degrees of image cropping, resizing, color correction and title treatment to serve a global audience.
As a global company that is constantly testing and experimenting with imagery, we have a collection of millions of images that we are continuously shifting and evolving. Manually grouping these images and maintaining those images can be expensive and time consuming, so we wanted to create a process that was smarter and more efficient.
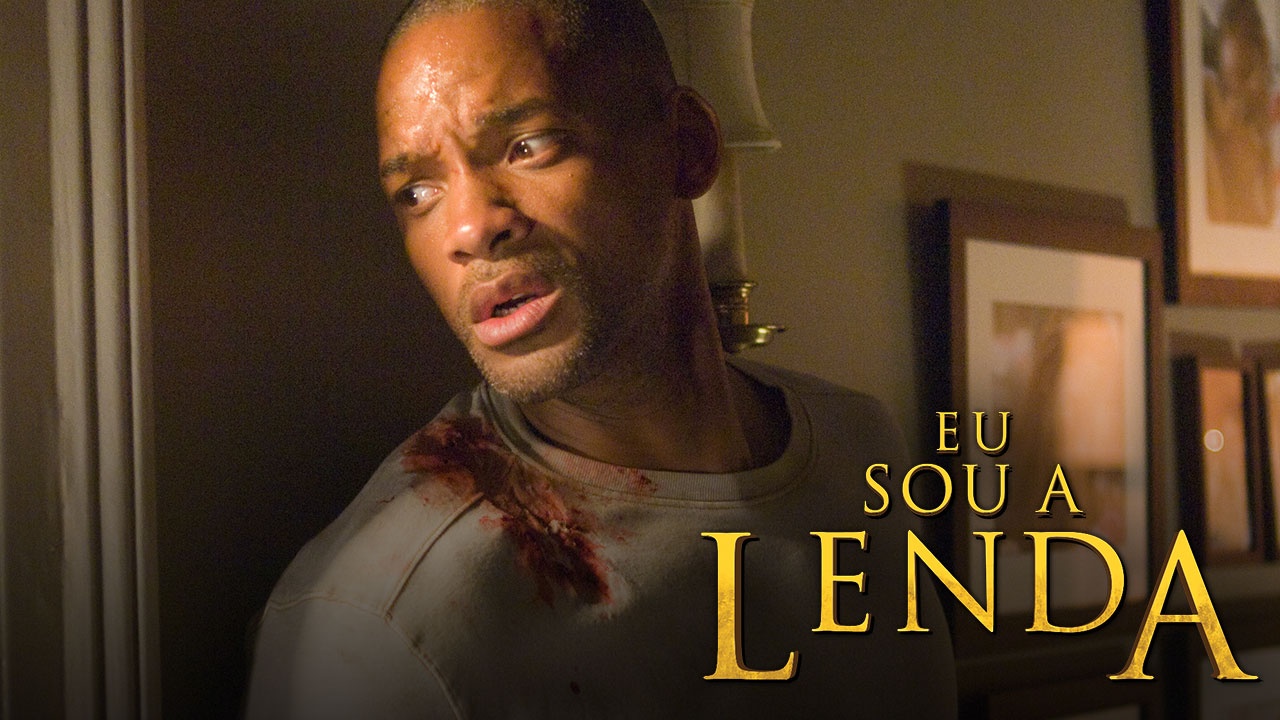 | 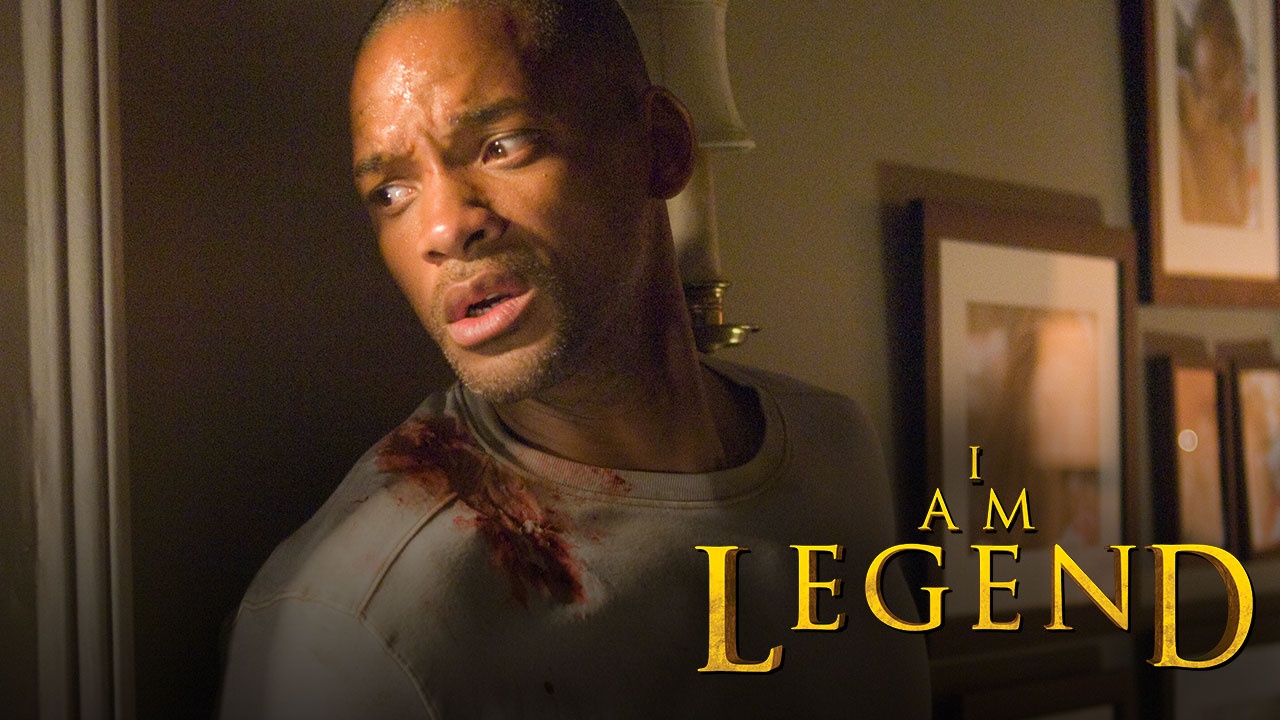 |
[An example of two images with slight color correction, cropping and localized title treatment]
These images are often transformed and color corrected so a traditional color histogram based comparison does not always work for such automated grouping. Therefore, we came up with an algorithm that uses the following combination of parameters to determine a similarity index - measurement of visual similarity among group of images.
We calculate similarity index based on following 4 parameters:
- Histogram based distance
- Structural similarity between two images
- Feature matching between two images
- Earth mover’s distance algorithm to measure overall color similarity
Using all 4 methods, we can get a numerical value of similarity between two images in a relatively fast comparison.
Below is example of images grouped based on a similarity index that is invariant to color correction, title treatment, cropping and other transformations:
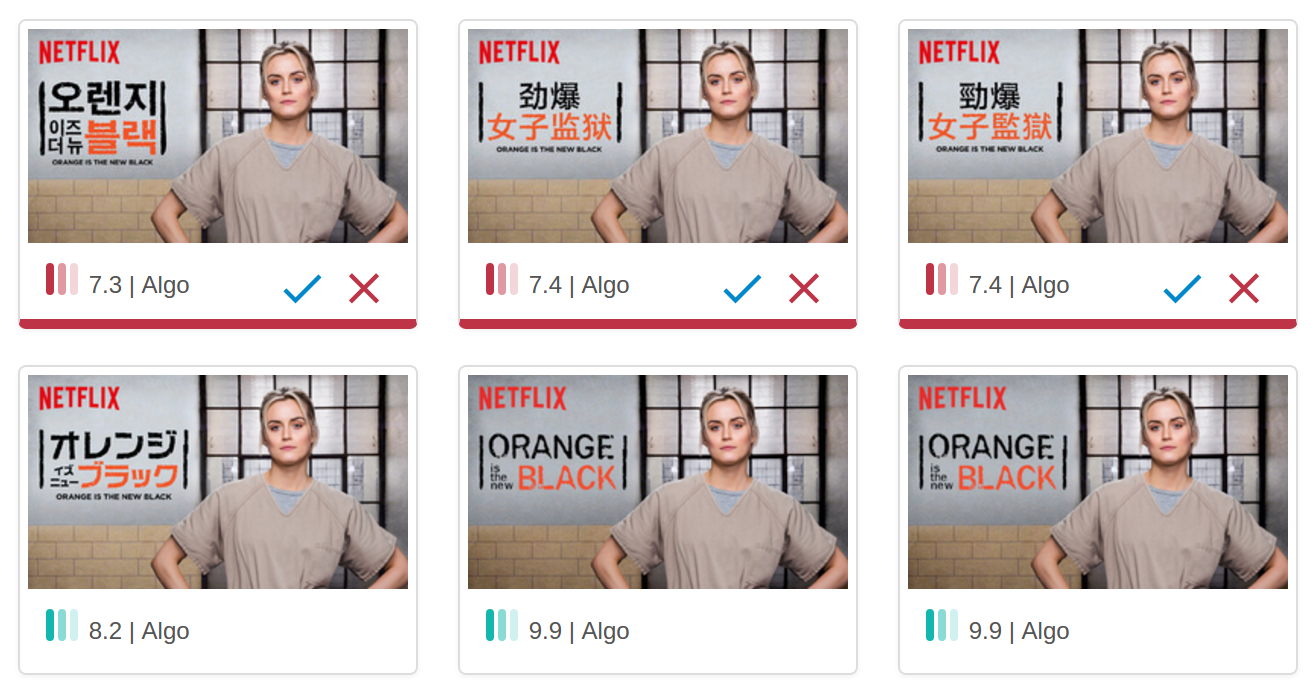
[Final result with similarity index values for group of images]
Images play a crucial role in first impression of a large collection of videos, and we are just scratching the surface on what we can learn from media and we have many more ambitious and interesting problems to tackle in the road ahead.
If you are excited and passionate about solving big problems, we are hiring. Contact us